Free Tool
Debug OpenTelemetry GenAI traces, instantly.
Paste an OTLP JSON trace from any OTel-instrumented agent and see it rendered as a readable conversation—span tree, token counts, latency, and tool calls. No install, no login, runs entirely in your browser.
Open Trace Viewer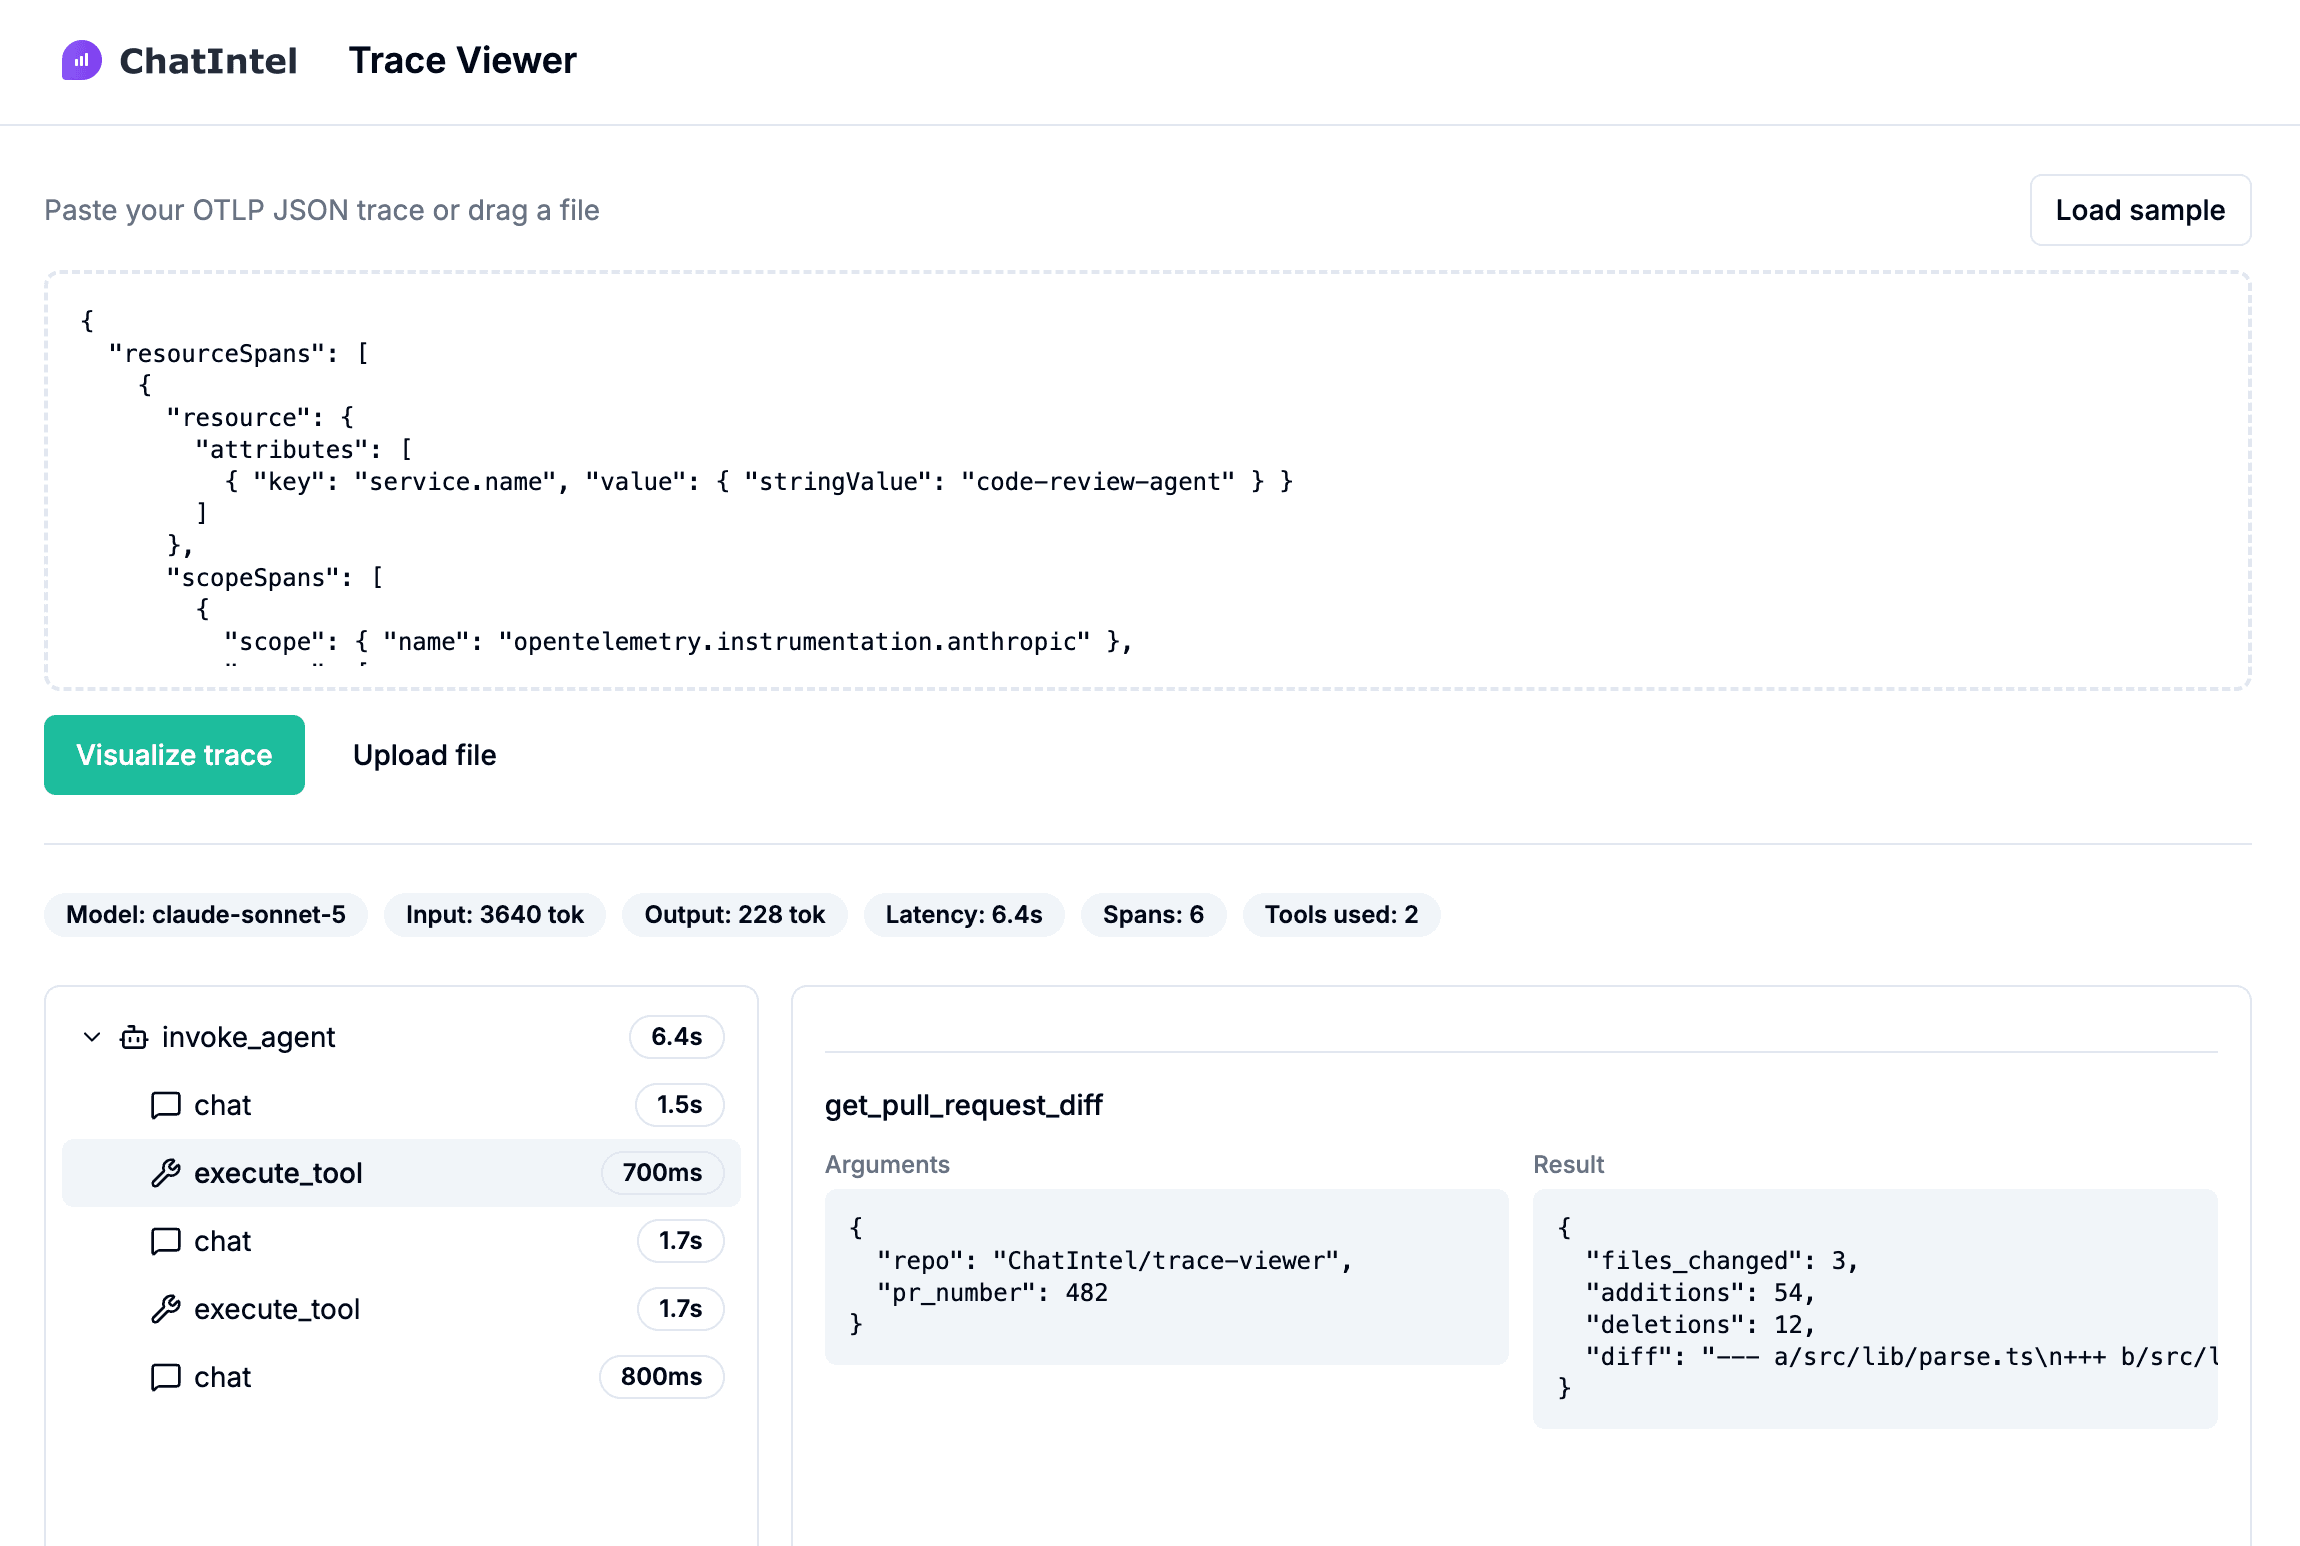
Span tree at a glance
See the full call hierarchy—agent invocations, chat turns, and tool calls—with per-span latency, collapsible and easy to scan.
Conversation view
System, user, and assistant messages rendered as chat bubbles instead of raw JSON attributes.
Tool call inspector
Arguments and results for every execute_tool span, pretty-printed side by side.
Token & latency stats
Model, input/output token counts, and total latency summarized in one bar as soon as a trace loads.
Want that same clarity across every conversation your agent has?
Trace Viewer is a debugging tool for one trace at a time. ChatIntel is the zero-code toolkit for evaluating, measuring, and improving AI agent quality across all of them.